dotlah! dotlah!
  • Cities
  • Technology
  • Business
  • Politics
  • Society
  • Science
  • About
Social Links
  • zedreviews.com
  • citi.io
  • aster.cloud
  • liwaiwai.com
  • guzz.co.uk
  • atinatin.com
0 Likes
0 Followers
0 Subscribers
dotlah!
  • Cities
  • Technology
  • Business
  • Politics
  • Society
  • Science
  • About
  • Cities
  • People

If Countries Were As Large As Their Populations, Here’s How The World Would Look Like

  • January 16, 2020
Source: https://ourworldindata.org/
Total
0
Shares
0
0
0

Maps are great instruments for navigation. However, they have little to say when it comes to describing how people are distributed in land.

What if the size of the countries depended on their population sizes? Theoretically, this will be how the world will look like:
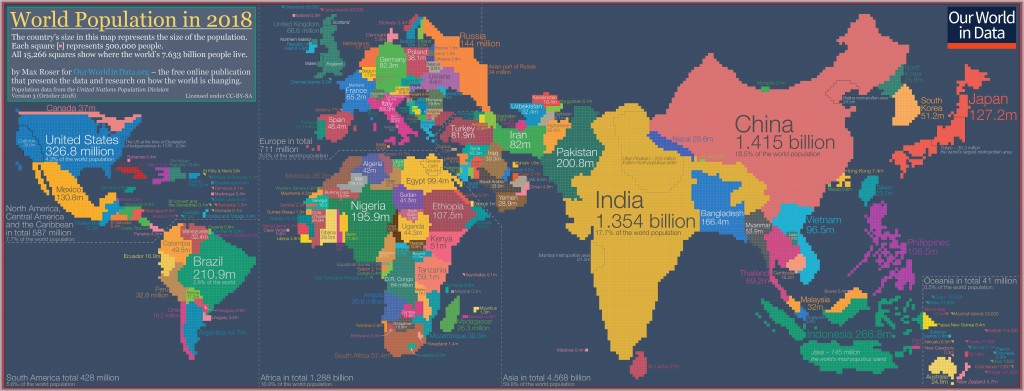
Source: https://ourworldindata.org/

To download the full-resolution image, you may do so here.

This is what is known as a cartogram. This particular one was made by Our World in Data.

In cartograms, the size of the population is used as scale instead of the land size. This way, one can clearly see how humanity is distributed across countries.

At first glance, this is clearly the world map that we’ve been used to. However, we can observe that some small countries will become humongous and some larger countries will diminish in size if we take into account the population size.

Uncovered insights

Through the cartogram, we can see some obvious observations like China and India being the most populous countries in the world.

If we look closer,  however, we can see relatively smaller countries like Japan and the Philippines depicted as extremely large.

A small country like Bangladesh will be just about the same size as the giant country of Russia if we only talk about population.

Basing from the map, a few number of countries can seemingly engulf the rest when it comes to sheer size. Our World In Data’s figures report that 13 countries in the world, together are home to 4.75 billion people, which is roughly 62% of the world’s population.

  • China (1.415 billion)
  • India (1.354 billion)
  • United States (326.8m)
  • Indonesia (266.8m)
  • Brazil (210.9m)
  • Pakistan (200.8m)
  • Nigeria (195.9m)
  • Bangladesh (166.4m)
  • Russia (144m)
  • Mexico (130.8m)
  •  Japan (127.2m)
  • Ethiopia (107.5m)
  • Philippines (106.5m)

Here is an interactive chart to explore the population growth from different countries:

A change in perspective

If our traditional maps barely have anything to say about the distribution of people in the world, we can expect that it will perform even worse in characterizing the living conditions in countries.

This is where visualizations like cartograms step in. Whenever we read about country statistics, we have to realize that an improvement in one country may be more or less impactful than the other.

For instance, Our World in Data cites life expectancy statistics: an improved life expectancy in Denmark equates to the improvement of the health of 5.8 million. However, an improved life expectancy in India will imply an improved health status of around 1.35 billion people.

Going back to our example of Russia and Nigeria, in spite of their extreme difference in land area, improvements in healthcare in these countries will amount to about the same magnitude of improvement.

The power of visualization

When we think of data analysis, people dealing with figures in order to arrive at estimates and decisions might come to mind.

However, an important instrument in revealing insights from the data is visualization. The human eye is a powerful analytical tool which can reveal things that a large set of numbers and statistical outputs cannot.

This is a sobering reminder for us now that we are receiving massive amounts of data in this digital age. The usefulness of data heavily relies on our ability to extract information and insights from it.

At times, the enormity of data can become burdensome. This rings even truer if we do not know how to handle it.

With this, we must continue to explore ways for data to speak to us. The ever-exploring mind is a crucial ingredient in paving the way towards inclusive policies and equitable reforms that we desire in this age.
Total
0
Shares
Share
Tweet
Share
Share
Related Topics
  • Data
  • Data Visualization
  • Maps
  • Population
dotlah.com

Previous Article
  • Business
  • Cities

Top Tips For Setting Up A Business In A US City

  • January 16, 2020
View Post
Next Article
  • Lah!

Changi Airport Begins Terminal 2 Expansion Works To Increase Capacity And Enhance Passenger Experience

  • January 17, 2020
View Post
You May Also Like
View Post
  • Featured
  • Features
  • People

Conclave: How A New Pope Is Chosen

  • Dean Marc
  • April 25, 2025
View Post
  • Cities
  • Research

Mathematicians uncover the logic behind how people walk in crowds

  • dotlah.com
  • April 3, 2025
“Toyota Woven City,” a Test Course for Mobility, Completes Phase 1 Construction and Prepares for Launch
View Post
  • Cities
  • Technology

“Toyota Woven City,” a Test Course for Mobility, Completes Phase 1 Construction and Prepares for Launch

  • John Francis
  • January 6, 2025
View Post
  • People

PM Wong takes Scoot flight, fellow passengers cheer

  • dotlah.com
  • October 16, 2024
View Post
  • Cities

Popes were once confined to Rome. Now they travel the world – and Francis’ current journey is particularly significant

  • dotlah.com
  • September 13, 2024
Singapore
View Post
  • Cities
  • Economy

South Africa’s new pension rules: Australia, Chile and Singapore show how personal savings can grow the economy

  • dotlah.com
  • August 30, 2024
Singapore
View Post
  • Artificial Intelligence
  • Cities
  • Technology

These 5 cities are making innovative use of generative AI

  • dotlah.com
  • July 29, 2024
dotlah-singapore-kharl-anthony-paica-Btf-M-Hu8Xw-unsplash
View Post
  • Artificial Intelligence
  • Cities
  • Technology

These 4 cities are making innovative use of generative AI

  • dotlah.com
  • May 16, 2024


Trending
  • 1
    • Lah!
    ACRA And SGX RegCo Emphasise Importance Of High-quality Financial Statements Amid COVID-19
    • July 29, 2020
  • 2
    • Lah!
    ABB To Provide Charging Infrastructure For Public E-Buses In Singapore
    • August 13, 2019
  • 3
    • Lah!
    NUS Business Analytics Centre And TigerGraph Collaborate To Strengthen Graph Database Capabilities
    • November 14, 2021
  • 4
    • Cities
    • Economy
    India’s Smartphone Market Set To Surge
    • September 22, 2023
  • 5
    • Lah!
    • Technology
    Locally Developed 60-Second Breath Test Receives Provisional Authorisation From HSA
    • May 24, 2021
  • 6
    • Cities
    Clean & Green Singapore 2021 Brings Online Learning Experiences, Exhibitions And Virtual Tours Until March 2022
    • November 23, 2021
  • 7
    • Cities
    • Environment
    • People
    Is Your City Making You Fat? How Urban Planning Can Address The Obesity Epidemic
    • February 24, 2020
  • 8
    • Technology
    Why Data Is Key To Solving Asia’s Most Pressing Problems
    • July 15, 2021
  • 9
    • Cities
    The State Of Global Gender Equity
    • October 30, 2023
  • 10
    • Lah!
    Driving Environmental Resilience, Energy Efficiency And Developing Food And Water Security Through The Singapore Sustainability Scholarship 2021
    • August 11, 2021
  • 11
    • Cities
    Reduction Of Toll Charges At Woodlands And Tuas Checkpoints
    • February 11, 2020
  • 12
    • Lah!
    The Secret To Defeating Thanos All Along
    • April 26, 2019
Trending
  • 1
    Trump’s global trade plans are in disarray, after a US court ruling on ‘Liberation Day’ tariffs
    • May 29, 2025
  • 2
    315,000 Singaporeans have used new career and skills planning tool by SkillsFuture Singapore
    • May 23, 2025
  • college-of-cardinals-2025 3
    The Definitive Who’s Who of the 2025 Papal Conclave
    • May 8, 2025
  • conclave-poster-black-smoke 4
    The World Is Revalidating Itself
    • May 7, 2025
  • oracle-ibm 5
    IBM and Oracle Expand Partnership to Advance Agentic AI and Hybrid Cloud
    • May 6, 2025
  • 6
    Conclave: How A New Pope Is Chosen
    • April 25, 2025
  • 7
    Canonical Releases Ubuntu 25.04 Plucky Puffin
    • April 17, 2025
  • 8
    Mathematicians uncover the logic behind how people walk in crowds
    • April 3, 2025
  • 9
    Tokyo Electron and IBM Renew Collaboration for Advanced Semiconductor Technology
    • April 2, 2025
  • 10
    Tariffs, Trump, and Other Things That Start With T – They’re Not The Problem, It’s How We Use Them
    • March 25, 2025
Social Links
dotlah! dotlah!
  • Cities
  • Technology
  • Business
  • Politics
  • Society
  • Science
  • About
Connecting Dots Across Asia's Tech and Urban Landscape

Input your search keywords and press Enter.